Observability in Modern Applications
Observability in Modern Applications: Logs, Metrics, and Traces
After deploying an application to production, it becomes difficult to investigate problems using traditional debugging techniques. We usually cannot attach a debugger to a production system, reproduce every issue locally, or see what happened inside the application at the exact moment when a problem occurred.
At the same time, we need to understand:
- Is our application healthy?
- Are users experiencing problems?
- Are we running out of resources?
- Which part of the system caused an issue?
- What exactly happened during an incident?
Observability helps us answer these questions.
What is observability?
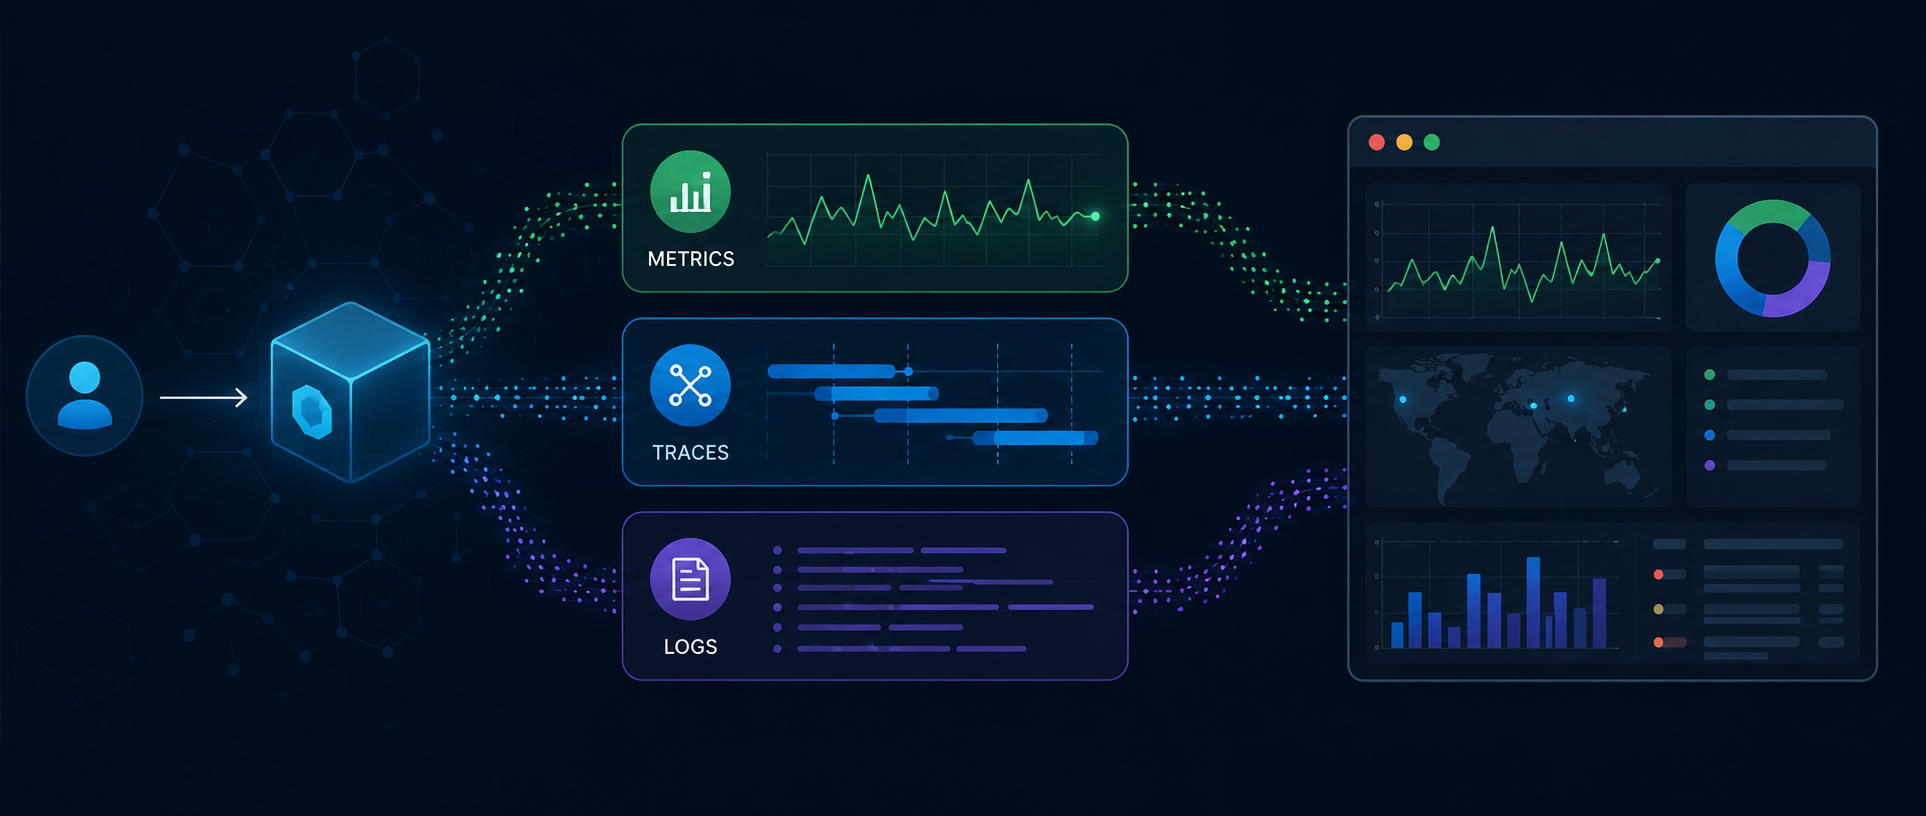
Observability is the ability to understand the internal state of a system by analyzing the telemetry it produces. A system constantly emits diagnostic information about its behavior. This information is called telemetry. The three primary telemetry signals are:
- Logs
- Metrics
- Traces
Observability is not a tool. It is the ability to understand a system by analyzing these telemetry signals.
Observability vs Monitoring
Monitoring answers the question:
“Is something wrong?”
It continuously evaluates predefined conditions, such as thresholds, health checks, and raises alerts when something abnormal happens. Examples:
- CPU usage exceeds 90%.
- Error rate increases above the expected value.
- A health check fails.
Observability answers a different question:
“Why did it happen?”
It helps engineers investigate incidents and understand the root cause. Monitoring detects problems. Observability explains them.
Metrics
Metrics are numerical measurements collected over time. Examples include:
- CPU usage
- Memory consumption
- Request rate
- Error rate
- Database latency
Metrics are aggregated by design. Instead of storing information about every request individually, they summarize system behavior over time. This makes them inexpensive to store and efficient for dashboards, monitoring, and alerting. However, metrics usually cannot explain what happened during one specific request.
Traces
A trace represents one execution of an operation. Examples:
- One HTTP request
- One Kafka message processing
- One background job execution
A trace consists of multiple spans. Each span represents one operation within the trace. Example:
Create Order
├── Validate request
├── Check inventory
├── Save to database
└── Call payment service
Each span records information such as:
- Operation name
- Start time
- Duration
- Parent-child relationship
Traces show how an operation flows through a system and where time is spent.
Logs
Logs are timestamped records of events. Examples:
- Order created.
- Payment failed.
- Database timeout.
Modern applications usually produce structured logs. Example:
{
  "level": "Error",
  "message": "Payment failed",
  "orderId": "12345"
}
Logs explain what happened during an operation. They can also include a Trace ID, allowing engineers to correlate logs with traces.
How they work together
Each telemetry signal answers a different question:
- Metrics → What is happening?
- Traces → Where is the problem?
- Logs → Why did it happen?
Imagine a customer reports:
“Placing an order takes 10 seconds.”
First, we inspect metrics. Metrics show that order latency has increased. Next, we open the trace for one slow request. The trace shows:
Create Order
├── Validate request (5 ms)
├── SQL query (9000 ms)
└── Payment service (50 ms)
Now we know where the delay occurred. Finally, we inspect logs associated with the trace. The logs reveal:
Query timeout.
Waiting for database lock.
Together, logs, metrics, and traces provide the complete picture.
OpenTelemetry
OpenTelemetry is an open-source observability framework. It provides APIs, SDKs, instrumentation libraries, and exporters for generating, collecting, and exporting telemetry in a vendor-neutral way. This allows applications to send telemetry to different observability platforms without changing application code. OpenTelemetry itself does not store telemetry. Storage and visualization are handled by observability backends such as Grafana, Jaeger, Prometheus, Elasticsearch, etc.
Telemetry pipeline
A simplified telemetry flow looks like this:
Application
    ↓
Instrumentation
    ↓
OpenTelemetry SDK
    ↓
Exporter
    ↓
Observability Backend
Telemetry can be produced automatically or manually.
Automatic instrumentation
Libraries can automatically collect telemetry for:
- HTTP requests
- Database calls
- External HTTP calls
- Runtime metrics
- Exceptions
Manual instrumentation
Developers should instrument business operations that the framework cannot understand. Examples include:
- Place Order
- Process Payment
- Reserve Inventory
- Generate Invoice
Conclusion
Observability allows engineers to understand what happens inside production systems. Metrics provide an overview of system behavior. Traces show how individual operations move through the system. Logs explain why those operations behaved the way they did. Together, these telemetry signals make production systems significantly easier to operate, troubleshoot, and improve.